

We’re glad to announce release 15 of Firetail packed with features and improvements that help you boost productivity and gain a deeper understanding of your data.
As always, don’t hesitate to get in touch if you have remarks, questions, problems or if you wish to discuss ideas or possible cooperations.
Have a great time exploring and we wish you all the best for your upcoming projects!
On behalf of the whole Firetail team
Tobias
A tour of Firetail 15 features
Widget management
The first aspect you may notice when opening Firetail 15 is our all new window management: all widgets and tools are now elements that you can drag around, treat as separate windows or dock them to the main window.
This provides you with a much better options of how to place your tool sets and how to distribute them across multiple desktops. You can even inspect your reporting results side by side with your data now!
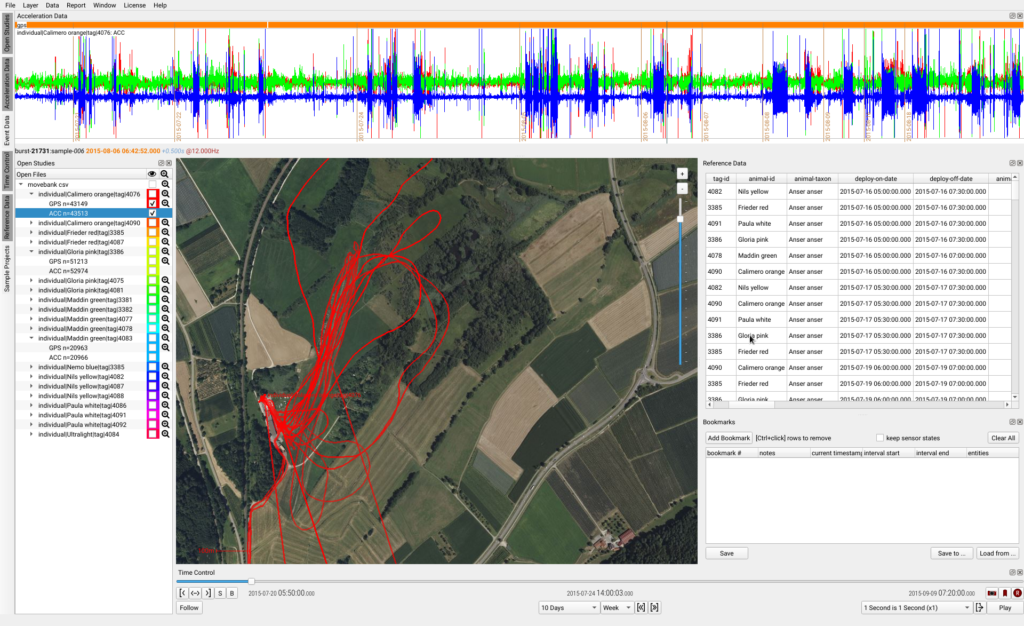
For us, this is a big step towards modular workflows that work side-by-side with interactive components leading to powerful possibilities for Firetail analysis.
e-obs data management
For our growing community of e-obs users, we added a new toolbox for managing handheld device data.
You can import data from one or more `logger.bin` raw data files, preview contained tags and their time ranges. The module will store local copies in a user-selected folder, see
File > Settings > e-obs Data Management
Point the settings to the current decoder version, define an archive folder and you’re ready to go!
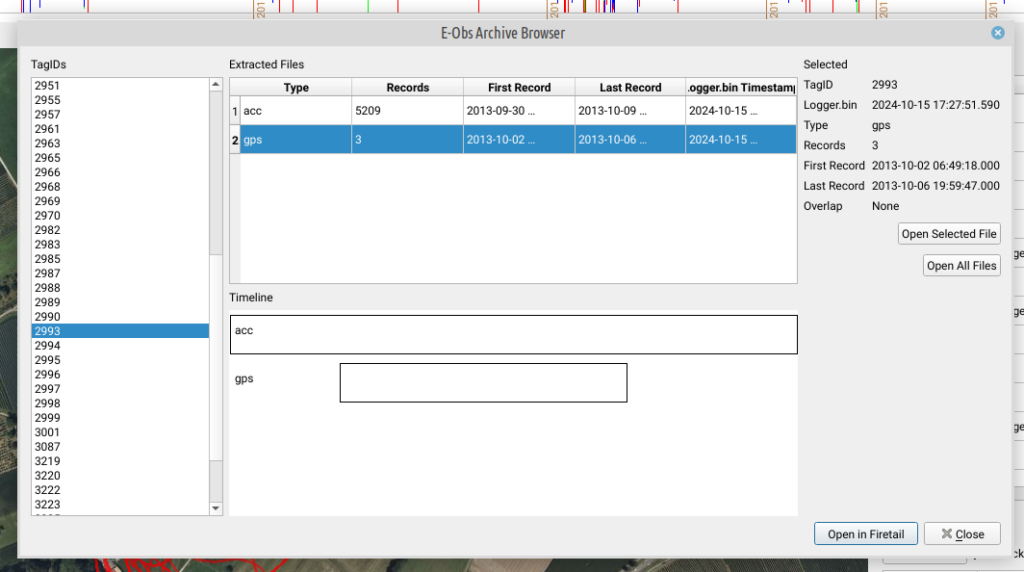
This workflow offers local data copies: remember to keep your raw research data backed-up at any time.
No backup procedure in place? Get in touch for scalable solutions.
KDE – FFT flavor
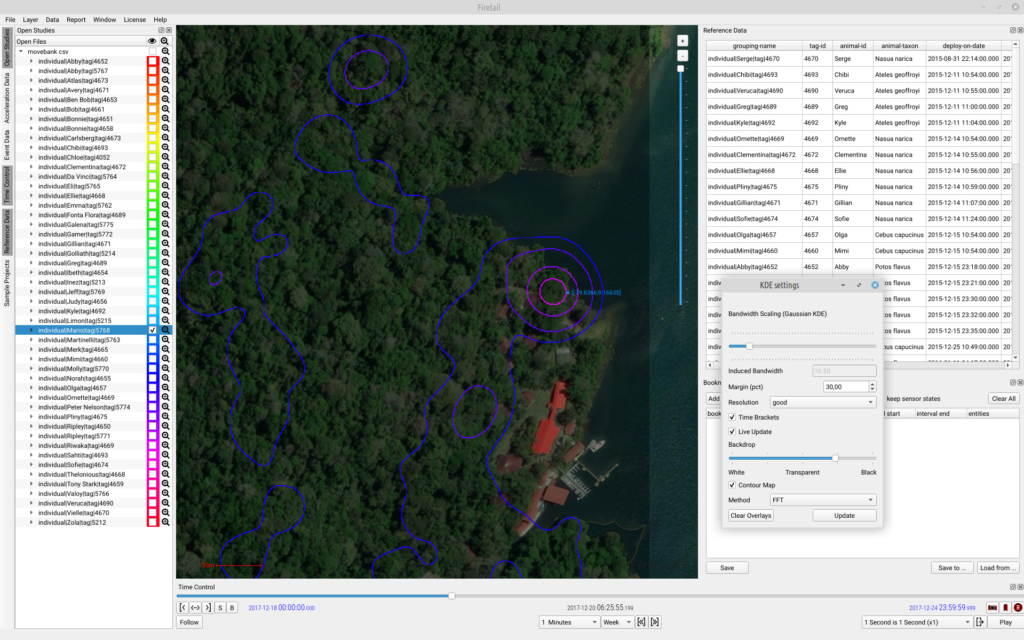
The kernel density estimation (KDE) module has been augmented with a Fast Fourier Transform (FFT) version which yields more precise results than the existing Box Filter variant in some cases.
You can easily swap the method in the KDE settings in
Data > Location and GPS > Kernel Density Map.
To improve the visiblity on the map you can now transition from an all-white, to transparent to an all-black background.
FireREACH
A completely new algorithm for utility distribution estimation was added in Firetail 15: FireREACH – REachbility Analysis using Characterstic Histograms.
Existing kernel density methods typically use point densitities to obtain utility distribution estimates. They rely on a pre-defined bandwith and GPS sampling rate changes will influence their results. Directional and timing information is not embedded in these models.
FireREACH, by contrast, is non-parametric and computes a speed distribution for each animal to obtain a characteristic histogram of typical movement speeds.
It will then, for each consecutive pair of locations, analyze the likelihood of a possible bypass. If GPS sampling rates are fast, this implies few degrees of freedom and the recorded track will govern the estimate. For reduced sampling intervals wider areas of exploration become possible, biased along the direction of location records.
The algorithm shifts the focus from what was observed to what movement was possible given the data.
FireREACH provides you with an additional perspective to the data and often allows for detailed, characteristic, direction-aware estimates.
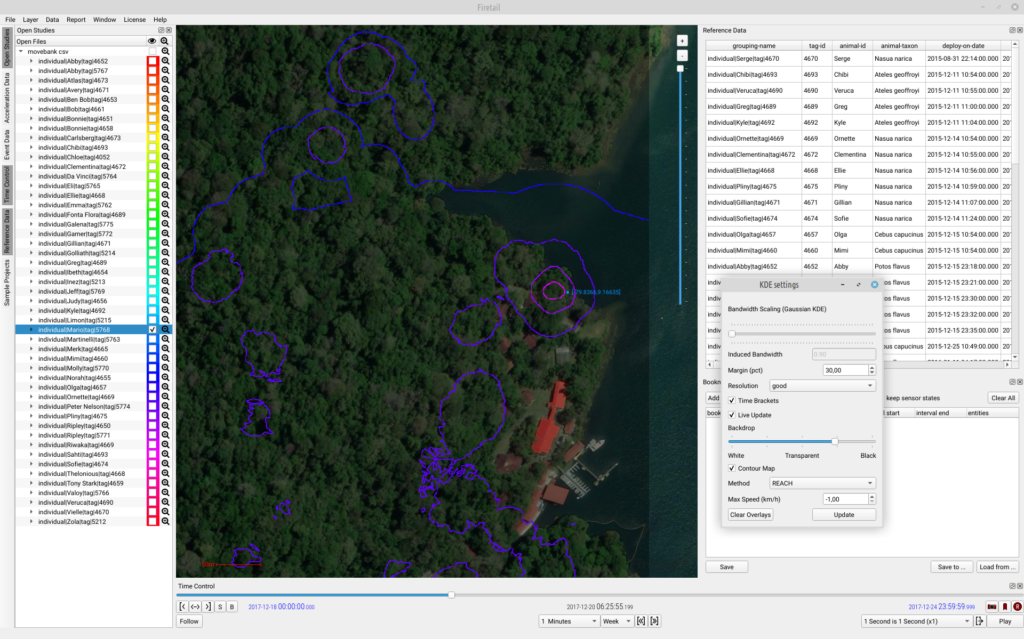
Feel free to get in touch if you would like to discuss this approach in more detail. FireREACH was designed to integrate many additional data sources for its reachability estimation.
Possibly your analysis and data is the perfect use-case!
Reporting: Track-Track Distances
If you are working with multiple animals or species one key question will come up: where and when did the individuals interact?
Firetail offers two modules to help with this question. Firstly, Episode Detection: use
Data > Location and GPS > Local Episodes.
To detect mutual time windows among tracks and to inspect episodes one-by-one.
The second approach is Track-Track Distances available from Report > Create Reports. For all selected individuals, you can compute the min/max/median/avg distance as an all-against-all matrix.
You can then sort each column (individual/entity) by the minimum distance to each other animal and jump to the respective time of interaction in the main timeline.
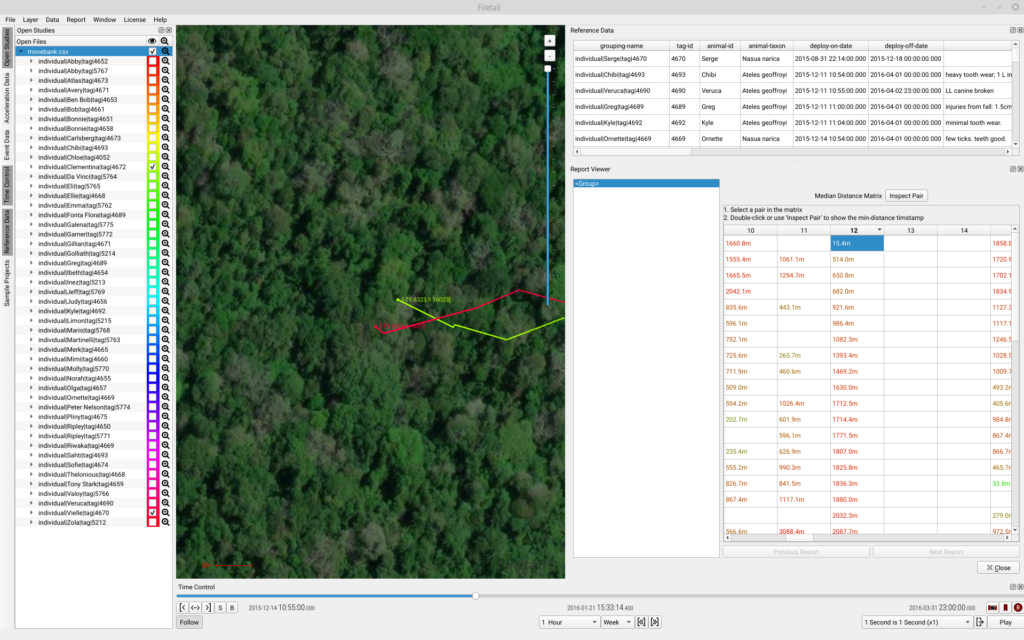
Notably, the result window is now also a dockable widget and you can conveniently place it within Firetail’s interface.
IMU data: HUD view
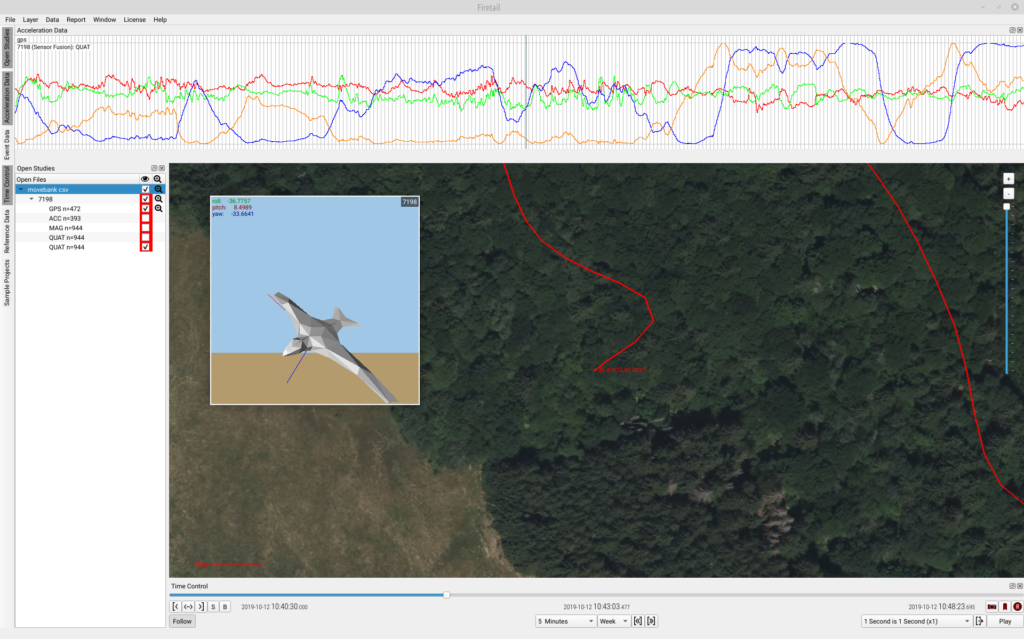
In Firetail 15 the IMU preview was extracted from the burst viewport in favor of a frameless HUD viewport. The preview is now scalable independently of the burst viewport and blends smoothly with the map viewport.
Build server revision
Microsoft enforced new constraints on artifact signing processes and application distribution. We took the opportunity and did a major overhaul of our build server migrating our build-chain to an all-fresh setup.
This was a major step to prevent technical debt and helps to keep Firetail’s tech-stack future-proof and ready for your challenges!