
Rapid visualisation and analysis for animal telemetry and sensor data
TL;DR: Firetail 11 is great, check it out 🙂
We’re glad to announce that the version 11 of Firetail is now officially released!
Available for Win/Mac/Linux.
This version is packed with a lot of new features and improvements, so let’s start right away with what is new!
Reporting module
For conservation and monitoring projects, we integrated the all-new reporting module.
With few easy steps, Firetail renders valuable building blocks for your next report from your project data.
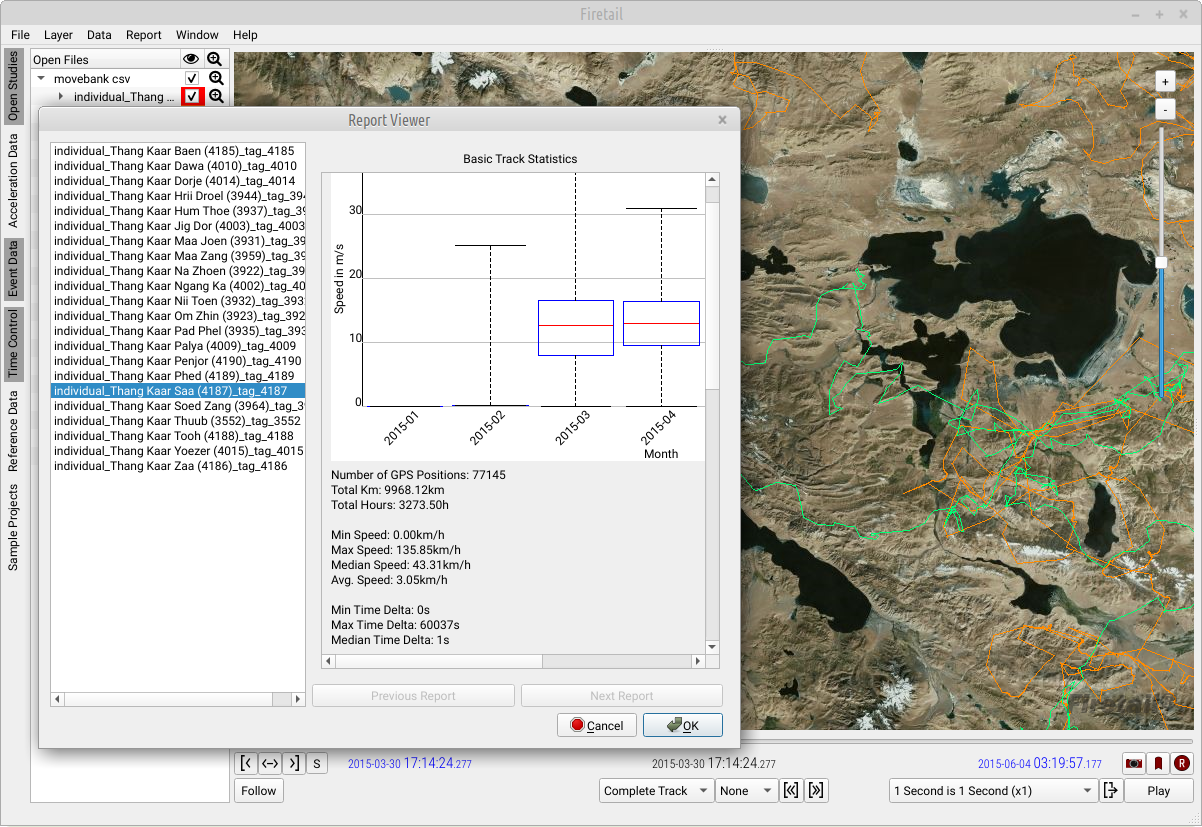
Per-animal statistics
You can easily generate statistics from custom time intervals:
- total km tracked
- total time observed
- min/max/avg speed
- speed distribution per month (boxplot)
- heading histogram (360 deg visual)
- map overview
- all-pairs sensor data (scatter plots)
- activity plots
Did individuals approach each other?
For groups of animals, Firetail provides a proximity matrix. Easily decide if two animals did come close during the selected analysis period.
Flexibile time intervals
Conveniently restrict observations to the last n days to report weeks, month, quartals. Define start and end dates for your report.
Save plots with a single (Ctrl/right) mouse click.
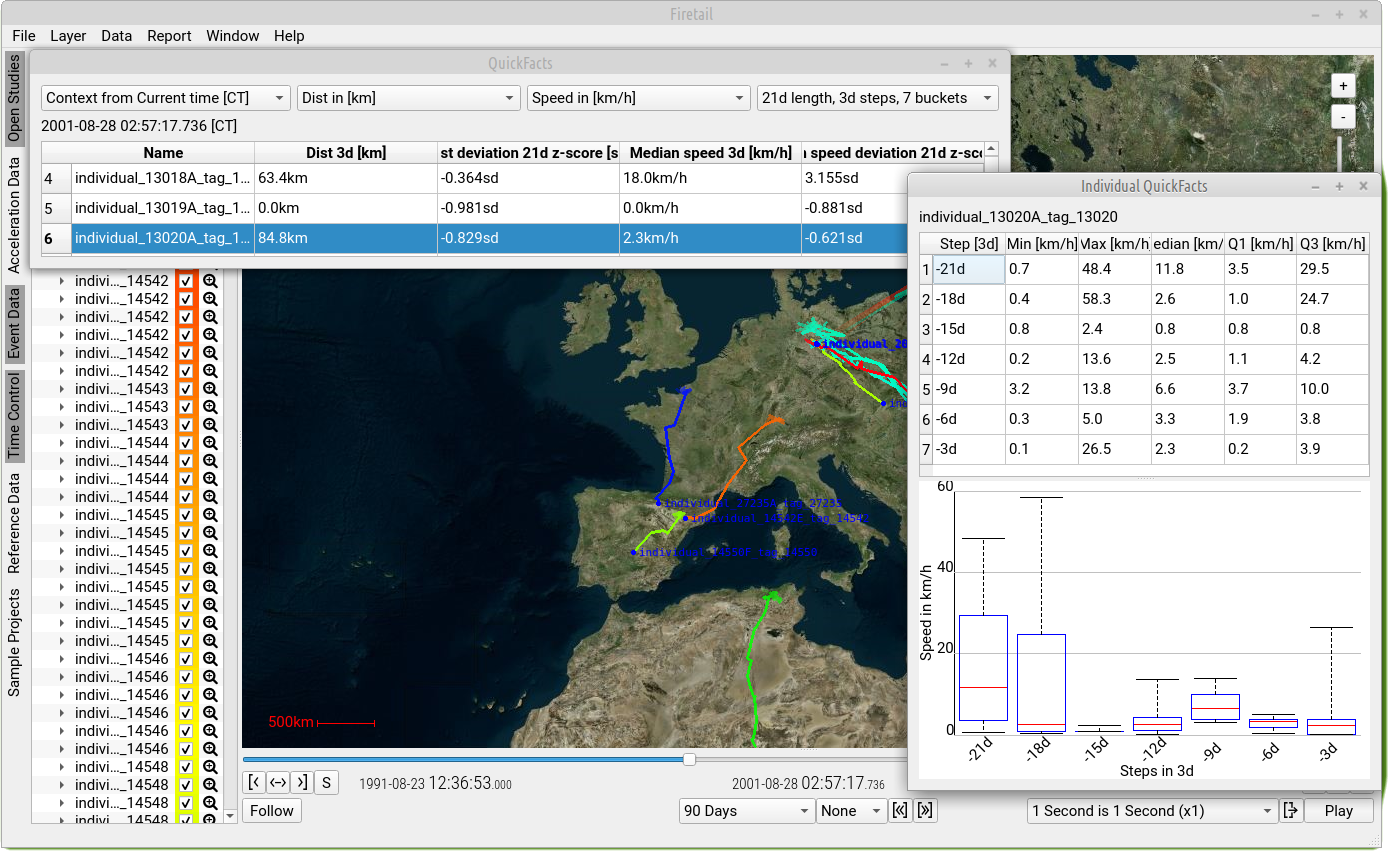
QuickFacts
Firetail now provides real-time statistics for the last few hours/days.
Toggle Report > Quickfacts and see
- the distance covered during the last hours/days (one step-length)
- long-term context (for step-length * buckets hours/days)
Did an animal show decreased/increased movement yesterday?
With QuickFacts, it is possible to answer these kind of questions interactively.
In this setting:
- we choose a step-length of 1 day (yesterday, measured from the current timestamp), and
- select a context of 7 days (7d length, 1d steps, 7 buckets).
Now we see the distance/speed traveled yesterday and a summary score (deviation score):
- the dist/speed scores are positive if the movement increased
- the dist/speed scores are negative if the movement decreased
The score is given in standard deviations, a larger deviation indicates a stronger offset.
Visualize exceptional movements
Numbers are crunchy and all, but the neat part about QuickFacts is of course it’s ability to show you the distribution of the selected context as a boxplot — in real-time, during replay.
Replay your data and just see if the last day was an exceptional one.
Powerful selections
Bracketing is a powerful concept in Firetail to define start and end intervals
- for further analysis,
- bookmarking, and
- increasingly precise selections of timestamps
Two easy, but powerful, additions can make your life easier now:
- selection to bracket
We can now create a bracketing from a selection on the map or the acceleration panel.
This is great for moving precisely within a selected interval or exporting and sharing selections as bookmarks! - bracket to selectionUsing the counterpart, we can start from a precise bracketing selection in main timeline and create a map/acceleration/event selection. Incredibly useful to share selected regions via bookmarks or define training intervals for FireSOM.
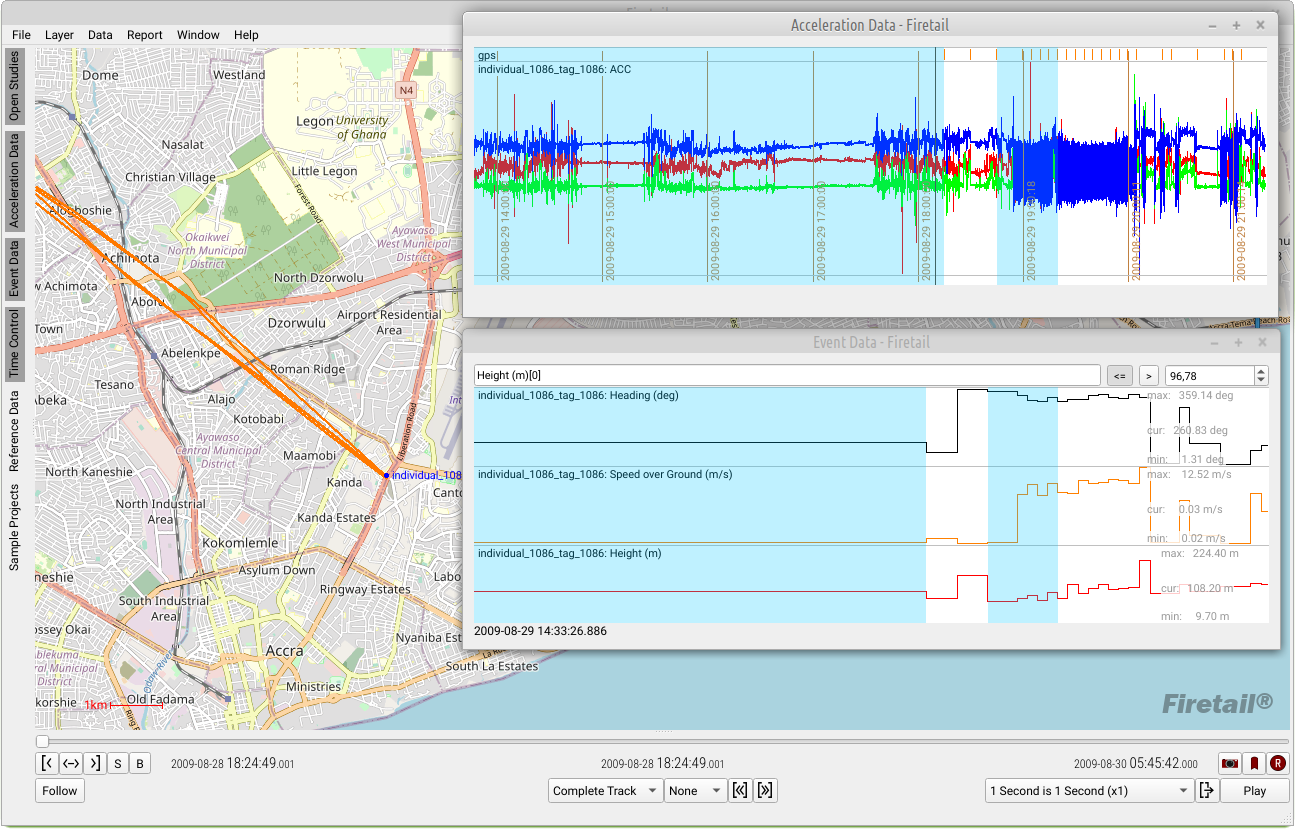
Numerical event thresholds
You may already know that Ctrl + mouse drag will create a selection based on a threshold of the event sensor data.
Now, once you created a threshold, you can enter the precise cutoff desired numerically. Sounds trivial, but enables a lot of new opportunities to select specific regions (high-speed, high-altitude) for both modeling and annotation.
ENV-Data
We added initial support for datasets that contains Movebank elevation data (via ENV-Data). Firetail’s first step to enable many more environmental information along with your data!
Video export
Firetail’s video export now supports arbitrary viewport ratios and will consume far less memory for long videos.
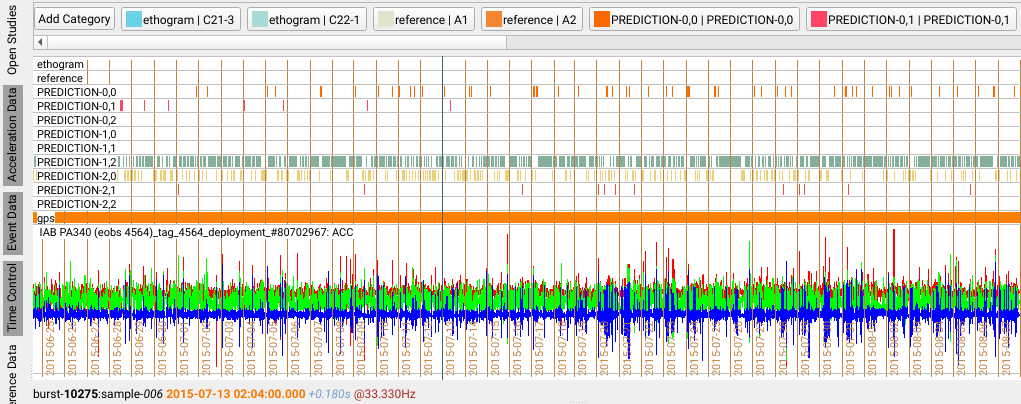
FireSOM
FireSOM is Firetail’s approach to deduce behavior from acceleration data.
The models are now automatically saved, even if you forget to do check this during training.
Group and layer renaming can be saved and automatically re-applied alongside with the model prediction for other time windows or even other individuals.
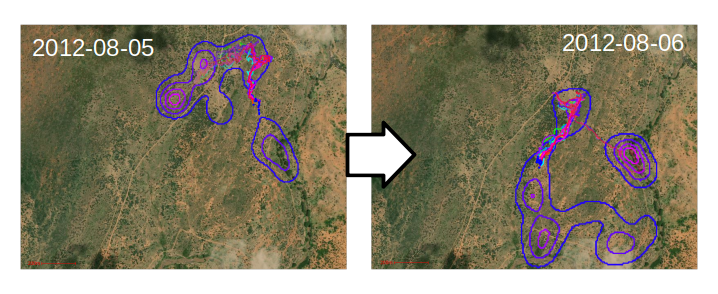
KDE speed improvements
Firetail’s kernel density estimation now consumes far less memory and will work much more fluent.
Vectronic: Activity data
Get your ACT Vectronic files from the drawer!
Firetail can now load Vectronic activity data with 5 min default intervals and treat them like acceleration data. That means you can browse the data along with your locations and even analyze it with FireSOM to segment, predict and annotate ACT data!
Nuts and bolts
A lot of details have been improved in terms of stability, readability, a new vector icon set, speed, memory and a lot of little details that make Firetail exiting to work with.