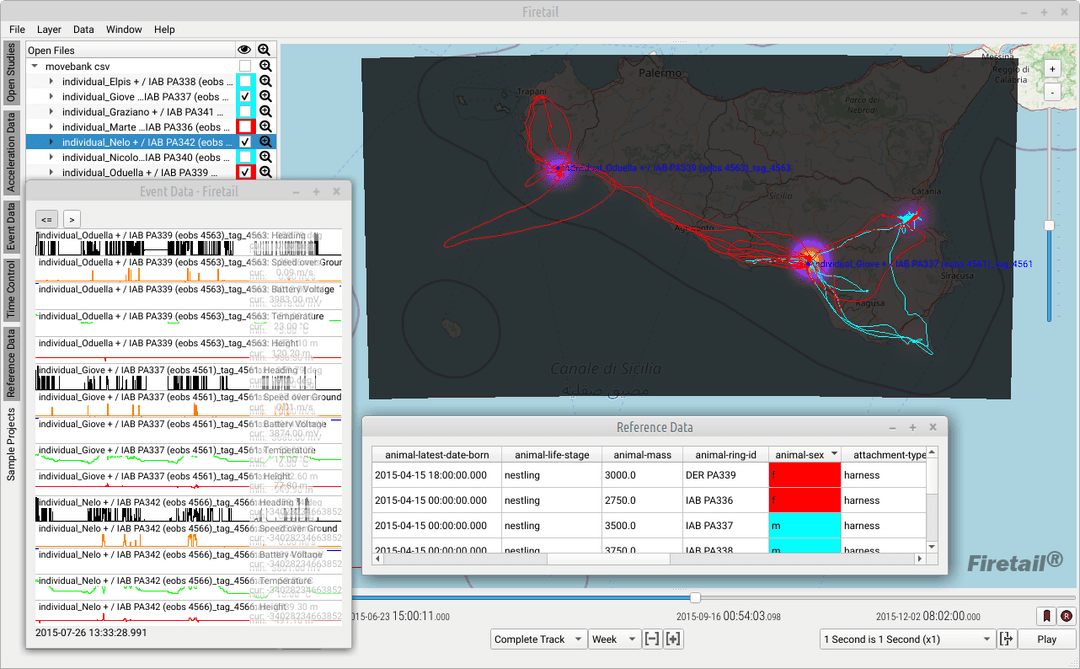
Classify animal behaviour from accelerometer data
Turn months of tri-axial acceleration bursts into behaviour categories like flying, resting or feeding, with an unsupervised model you can inspect, refine and check against ground truth.
Why this is hard
Modern tags record acceleration on three axes in short bursts, and a deployment can produce a great many of them. Each burst tells you how the animal moved in those seconds, but looking at every burst by hand quickly becomes time-consuming, and for large datasets near-impossible.
How Firetail does it: FireSOM
FireSOM is an assistive, unsupervised method. It sorts bursts into groups of similar movement patterns; you decide what each group means.
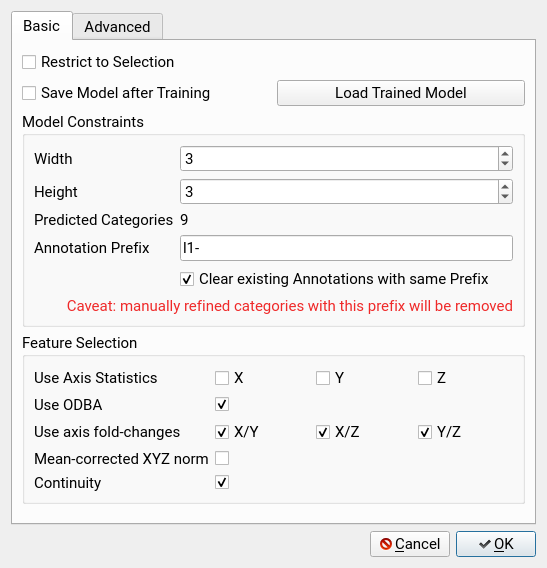
- Choose features. You pick feature groups instead of single features: per-axis statistics (minimum, maximum, median, quartiles), the overall dynamic body acceleration (ODBA), fold-changes between axes, the mean-corrected norm, and a continuity measure.
- Train the map. Firetail normalises the features and trains a self-organizing map, a small grid in which every node stands for a potential category.
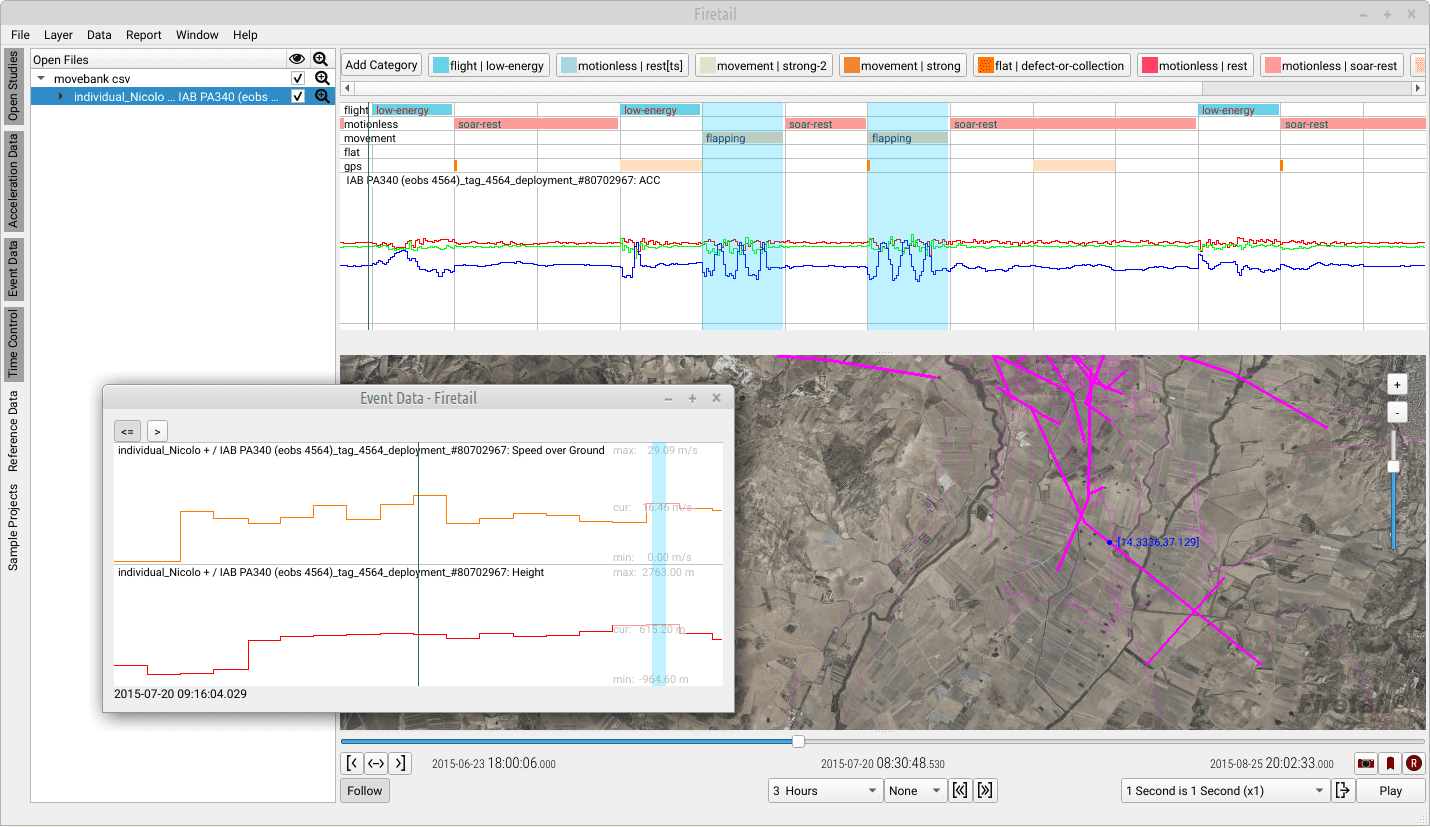
- Assign every burst. Each burst lands in the category it resembles most. The categories appear as annotation layers directly above the raw acceleration data.
- Give them meaning. Look at each category in context, alongside the GPS track, the map, other sensors or video, then rename, merge or discard categories.
Start simple, then refine
Start with a 3×3 map, nine categories at most, and basic statistics: this will likely separate active from inactive patterns. Categories that still mix several behaviours can be refined: turn their regions into a selection and train a local model on just those bursts; select at least a few hundred of them. More categories need a larger map, and a larger map needs more training data.
Where you already know what the animal did, you can also annotate regions by hand: select them in the bursts or on the map and assign a category.
Reuse a model on other animals
A trained model can be saved, including your renamed and regrouped categories, and applied to other tags, individuals or deployments. Firetail can't detect biases between tags on its own, so transferred predictions should be checked against an independent reference.
Check the result against ground truth
Firetail has no built-in way to judge whether a model is right, so the check comes from outside: manual annotations, video observations synchronized with the acceleration data, or annotations from tools like BORIS. Firetail's evaluation module compares such a reference with the predicted categories and reports precision, recall and F-measure from the overlapping segments.
Done in published research
Peer-reviewed studies and preprints that used Firetail for this, from our publication list.
- Ground-truth validation of behavioral classifications from accelerometer data using an integrated GPS-accelerometer-camera device: application to an elusive scavenger
Animal Biotelemetry (2026)
Firetail used for: Video-based ground truth for Self-Organizing Map behaviour classification of king vultures (tailored Firetail modules)
- Home ranges, feeding sites, and daily movement behavior of the highly threatened Livingstone’s fruit bat revealed through GPS tracking
Conservation Science and Practice (2025)
Firetail used for: FireSOM behavioural annotation of GPS points to identify potential feeding sites
- Death detector: Using vultures as sentinels to detect carcasses by combining bio-logging and machine learning
Journal of Applied Ecology (2024)
Firetail used for: Annotating active and passive flight in acceleration data to complete the reference data for a behaviour classifier
- Classifier architecture and data preprocessing jointly shape accelerometer-based behavioural inference
bioRxiv (2026)
Firetail used for: Synchronising video and acceleration data to train behaviour classifiers
Get Firetail
free downloadGet started with Firetail today! Interactively process high-density data for multi-animal, multi-year projects!
“No risk: request a three-month trial, kickstart your analysis and see your data in an all-new light!”